macOS系统PHP7增加Xdebug
文章目录
Apple 在发布 macOS High Sierra 后,系统也终于自带了 php v7.1,相比于之前,如果想使用 php7,还得额外想办法( Homebrew 或者 php-osx )而言着实方便了不少。
但是,系统自带的 PHP 只有基础的配置,如果想做 PHP 开发,Xdebug 还是必须的,以下就总结一下如何在 macOS High Sierra 中为系统自带的 PHP 增加 Xdebug 模块。
基础环境( macOS 及 PHP 信息)
- macOS High Sierra: v10.13.3
- PHP: v7.1.7
安装 Xdebug
Xdebug 官网安装文档中有 MAC 推荐的方式,鉴于系统自带的是 PHP 是v7.1.7,所以在选择的时候,需要选择php71-xdebug这个安装包。
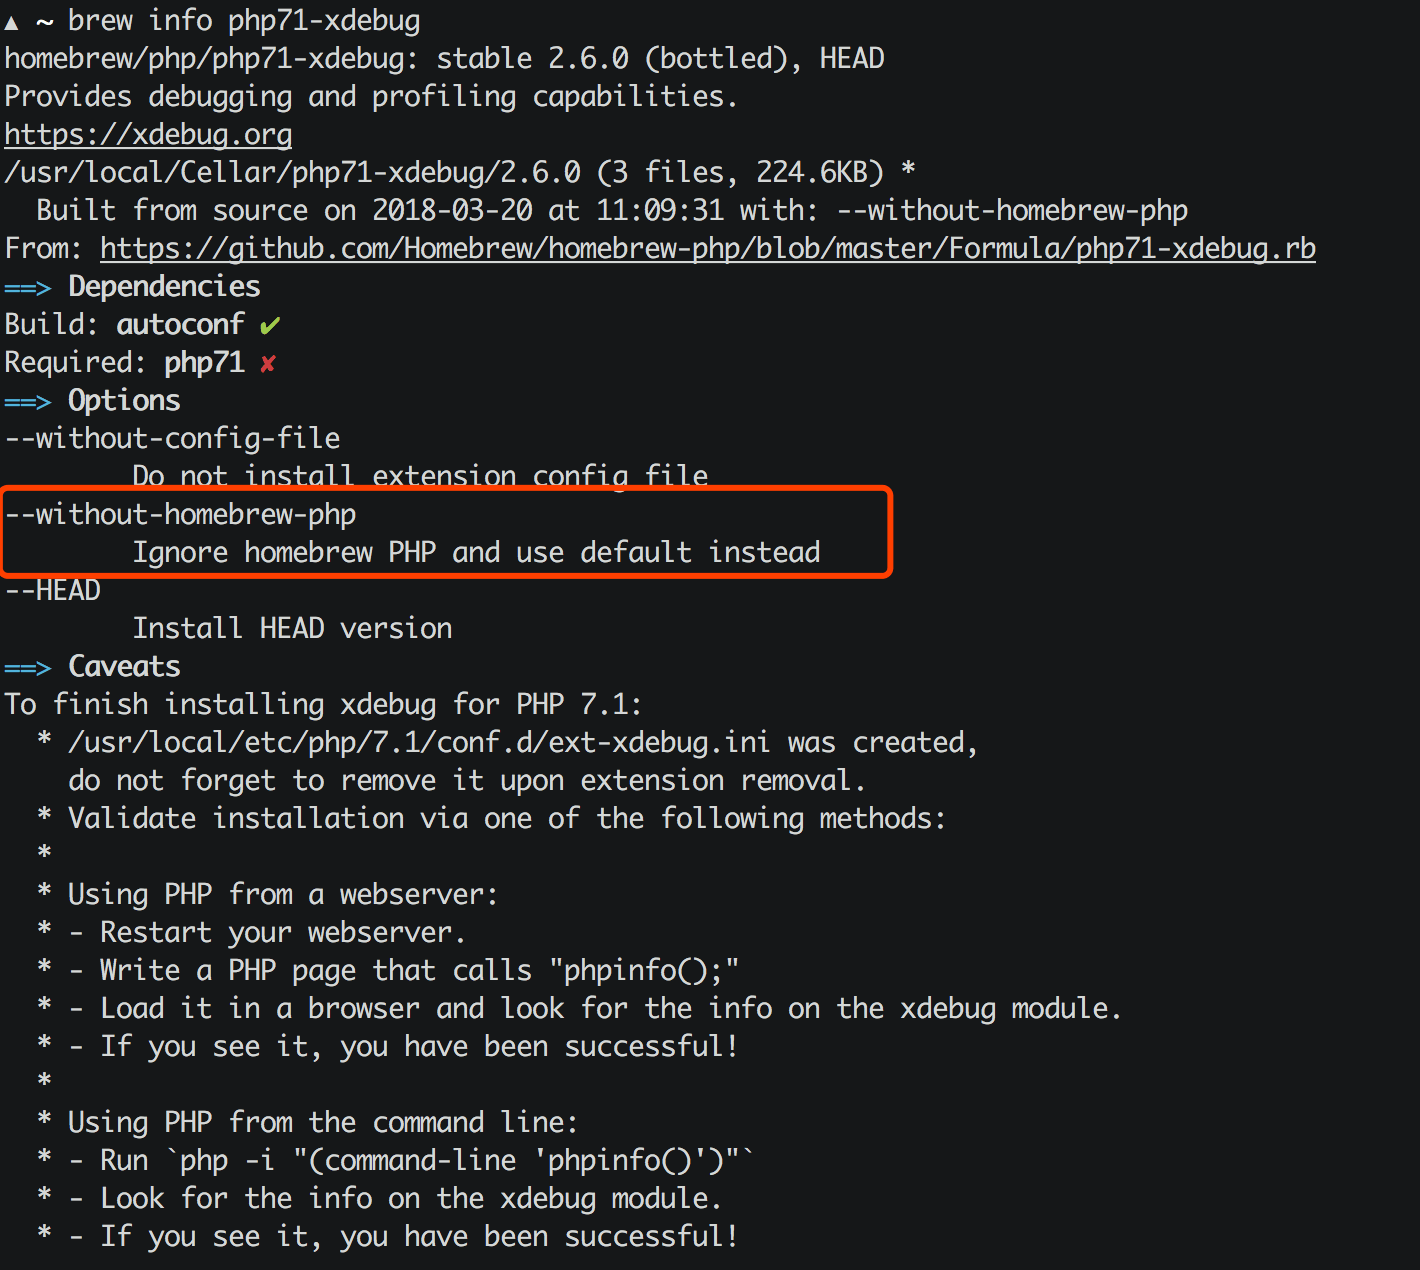
另外由于 brew 中的php71-xdebug依赖于php71的,所以建议加上--without-homebrew-php这个参数,这样的话 brew 就会忽略安装php71。
| |
不过这个时候,或许你会碰到下面这样的报错:
| |
提示缺失依赖,从而导致phpize无法正常工作,phpize是用来准备 PHP 扩展库的编译环境的,理论上系统自带的 PHP 应该是有phpize的,但是没有在/usr/include/php/*里面找到它需要的模块,并且检索/usr/include时发现这个目录根本不存在。
Google 了一圈,解决问题,就需要在/usr/include中补全相关的内容,在 OSX v10.10 以前系统,需要手动做软链来解决:
| |
但是 v10.11 以后的系统重写了安全策略,所以会遇到权限问题(sudo也不行):
| |
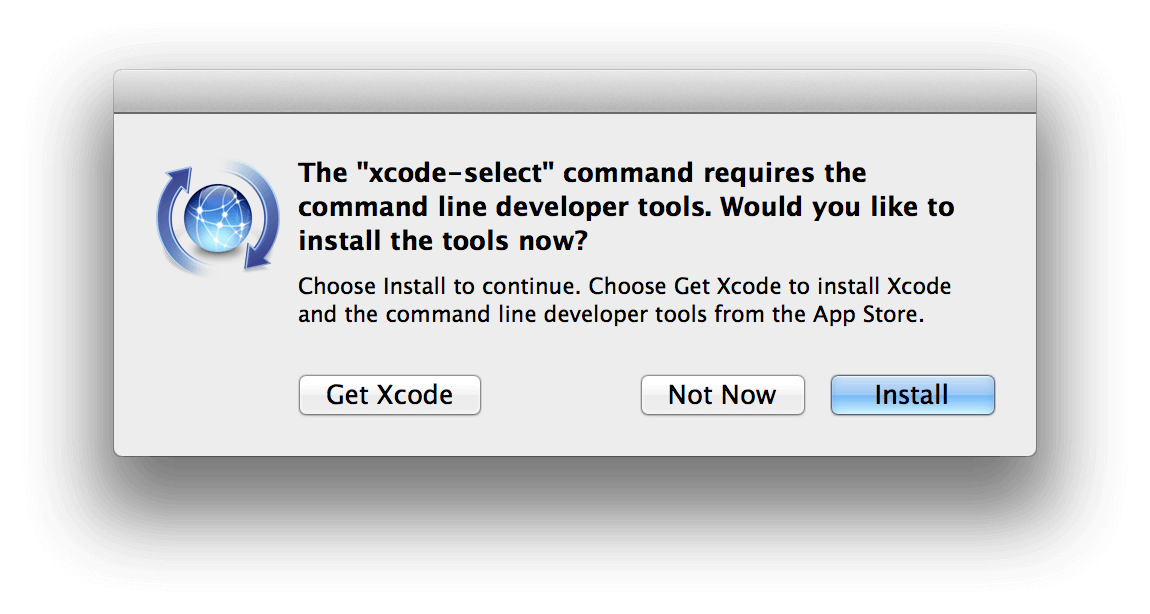
不过好在 Apple 为开发人员准备了 Xcode,这是一个很强大的工具,但是体积也很大(下载安装有点慢),而一般我们只需要它提供的Command Line Tools就够了,上面的问题,其实只要安装Command Line Tools就可以解决:
| |
接下来,跟着提示做,安装、同意协议…
等待安装结束以后,再用 brew 来安装 php71-xdebug:
| |
一切结束以后,brew 会给出提示:
| |
开启 PHP 的 Xdebug
经过上面步骤,系统里面是有 Xdebug 了,但是在php.ini配置文件中不一定有,因此需要手动添加 Xdebug 的配置项:
| |
然后就是重启php-fpm:
| |
运行php -i "(command-line 'phpinfo()')" | grep xdebug后,你就可以看到关于 Xdebug 的配置内容了:
| |
Visual Studio Code - PHP Debug
VSCode 是目前最流行的开发工具之一,虽然轻量,但是对标各类 IDE 毫不逊色,微软良心之作,通过安装不同的插件可以扩展它的能力,其中有一款 PHP Debug 的插件,可以作为 Xdebug 的桥梁,方便直接通过 Xdebug 调试 PHP,官方的描述十分贴切:
PHP Debug Adapter for Visual Studio Code
官网的指导也写的相当不错:
- Install XDebug > I highly recommend you make a simple
test.phpfile, put aphpinfo();statement in there, then copy the output and paste it into the XDebug installation wizard. It will analyze it and give you tailored installation instructions for your environment. In short:
- On Windows: Download the appropiate precompiled DLL for your PHP version, architecture (64/32 Bit), thread safety (TS/NTS) and Visual Studio compiler version and place it in your PHP extension folder.
- On Linux: Either download the source code as a tarball or clone it with git, then compile it.
- Configure PHP to use XDebug by adding
zend_extension=path/to/xdebugto your php.ini. The path of your php.ini is shown in yourphpinfo()output under “Loaded Configuration File”.- Enable remote debugging in your php.ini:
1
2
3
[XDebug] xdebug.remote_enable = 1 xdebug.remote_autostart = 1There are other ways to tell XDebug to connect to a remote debugger than
remote_autostart, like cookies, query parameters or browser extensions. I recommendremote_autostartbecause it “just works”. There are also a variety of other options, like the port (by default 9000), please see the XDebug documentation on remote debugging for more information. 4. If you are doing web development, don’t forget to restart your webserver to reload the settings 5. Verify your installation by checking yourphpinfo()output for an XDebug section.
这里需要注意的是它推荐开启 Xdebug 配置项中的remote_autostart这一项。
好了,经过上面的操作,你应该可以跟 Demo 里面一样在 VSCode 中调试 PHP 了。
文章作者 tony
上次更新 2018-03-19